The Low Carb Myth

The “Goldilocks Effect”

Author: Dr. Stephen Chaney

low carb dietThe low carb wars rage on. Low carb enthusiasts claim that low-carb diets are healthy. And they claim the lower you go, the healthier you will be. Let me start with some definitions:

  • The typical American diet is high carb. It gets about 55% of its calories from carbohydrates. [Note: The Mediterranean and DASH diets also get about 55% of their calories from carbohydrates. I’ll talk more about that later.]
  • Moderate carb diets get 26-46% of their calories from carbohydrates. Examples include the low carb Mediterranean diet and the Paleo, South Beach, and Zone diets.
  • Low carb diets get <26% of their calories from carbohydrates. The Atkins diet is the classic example of a low carb diet.
  • Very low carb diets get <10% of their calories from carbohydrates. Examples are the Keto and Carnivore diets.

And I don’t need to tell you that the Keto and Carnivore diets are receiving a lot of favorable press lately.

But some health experts warn that low carb and very low carb diets may be dangerous. For example, several studies have reported that low carb diets increase the risk of mortality (shorten lifespan).

As a consumer you are probably confused by the conflicting claims. Are low carb diets healthy, or is this another myth? In this issue of “Health Tips From the Professor” I am going to discuss two very large studies that came to opposite conclusions.

Both were what we call meta-analysis studies. Simply put, that means they combine the data from several smaller studies to obtain more statistically reliable data. But as Mark Twain said, “There are lies. There are damn lies. And then there are statistics.”

The first study, called the Prospective Urban Rural Epidemiology (PURE) study, was published a few years ago. It included data from 135,335 participants from 18 countries across 5 continents. That’s a very large study, and normally we expect very large studies to be accurate.

It showed a linear relationship between carbohydrate intake and mortality. Simply put, the more carbohydrate people consumed, the greater their risk of premature death. The results from the PURE study had low carb enthusiasts doing a victory lap and claiming it was time to rewrite nutritional guidelines to favor low carb diets.

SkepticWhenever controversies like this arise, reputable scientists are motivated to take another look at the question. They understand that all studies have their weaknesses and biases. So, they look at previous studies very carefully and try to design a study that eliminates the weaknesses and biases of those studies. Their goal is to design a stronger study that reconciles the differences between the previous studies.

And this study had two glaring weaknesses.

  • The percent carbohydrate intake ranged from 40% to 80%. It showed that a moderate carbohydrate intake might be healthier than a high carbohydrate intake, but it provided no information about low carb or very low carb diets.
  • The data was primarily from Asian countries. It was not clear whether it was relevant to the kind of diets consumed in North America and Europe.

A second study published a year later (SB Seidelmann et al, The Lancet, doi.org/10.1016/S2468-2667(18)30135-X) eliminated these weaknesses and resolved the conflicting data.

How Was The Second Study Done?

clinical studyThis study was performed in two parts. This first part drew on data from the Atherosclerosis Risk in Communities (ARIC) study. That study enrolled 15,428 men and women, aged 45-64, from four US communities between 1987 and 1989. This group was followed for an average of 25 years, during which time 6283 people died.

Carbohydrate intake was calculated based on food frequency questionnaires administered when participants enrolled in the study and again 6 years later. The study evaluated the association between carbohydrate intake and mortality.

The second part was a meta-analysis that combined the data from the ARIC study with all major clinical studies since 2007 that measured carbohydrate intake and mortality and lasted 5 years or more. The total number of participants included in this meta-analysis was 432,179, and it included data from previous studies that claimed low carbohydrate intake was associated with decreased mortality.

The Low Carb Myth

The results from the ARIC study were:

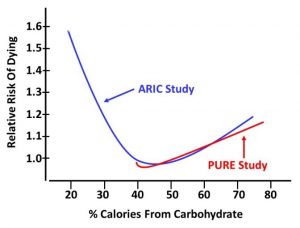
GravestoneThe relationship between mortality and carbohydrate intake was a U-shaped curve.

    • The lowest risk of death was observed with a moderate carbohydrate intake (50-55%). This is the intake recommended by current nutrition guidelines.
    • The highest risk of death was observed with a low carbohydrate intake (<20%).
    • The risk of death also increased with very high carbohydrate intake (>70%).
  • When the investigators used the mortality data to estimate life expectancy, they predicted a 50-year-old participant would have a projected life expectancy of:
    • 33.1 years if they had a moderate intake of carbohydrates.
    • 4 years less if they had a very low carbohydrate intake.
    • 1.1 year less if they had a very high carbohydrate intake.
  • And the risk associated with low carbohydrate intake was affected by what the carbohydrate was replaced with.
    • When carbohydrates were replaced with animal protein and animal fat there was an increased risk of mortality on a low-carb diet.

The animal-based low-carb diet contained more beef, pork, lamb, chicken, and fish. It was also higher in saturated fat.which low carb diets are healthy

    • When carbohydrates were replaced with plant protein and plant fats, there was a decreased risk of mortality on a low-carb diet. The plant-based low-carb diet contained more nuts, peanut butter, dark or whole grain breads, chocolate, and white bread. It was also higher in polyunsaturated fats.
  • The effect of carbohydrate intake on mortality was virtually the same for all-cause mortality, cardiovascular mortality, and non-cardiovascular mortality.
  • There was no significant effect of carbohydrate intake on long-term weight gain (another myth busted).

The results from the dueling meta-analyses were actually very similar in some respects. When the data from all studies were combined:

  • Very high carbohydrate diets were associated with increased mortality.
  • Meat-based low-carb diets increased mortality, and plant-based low-carb diets decreased mortality.
  • The results were the same for total mortality, cardiovascular mortality, and non-cardiovascular mortality.

The authors concluded: “Our findings suggest a negative long-term association between life-expectancy and both low carbohydrate and high carbohydrate diets…These data also provide further evidence that animal-based low carbohydrate diets should be discouraged.

Alternatively, when restricting carbohydrate intake, replacement of carbohydrates with predominantly plant-based fats and proteins could be considered as a long-term approach to healthy aging.”

Simply put, that means if a low carb diet works best for you, it is healthier to replace the carbs with plant-based fats and protein rather than animal-based fats and protein.

The “Goldilocks Effect”

Goldilocks EffectThis study also resolved the discrepancies between previous studies. The authors pointed out that the PURE study relied heavily on data from Asian and developing countries, and the average carbohydrate intake is very different in Europe and the US than in Asian and developing countries.

  • In the US and Europe mean carbohydrate intake is about 50% of calories and it ranges from 25% to 70% of calories. With that range of carbohydrate intake, it is possible to observe the increase in mortality associated with both very low and very high carbohydrate intakes.
  • The US and European countries are affluent, which means that low carb enthusiasts can also afford diets high in animal protein.
  • In contrast, white rice is a staple in Asian countries, and protein is a garnish rather than a main course. Consequently, overall carbohydrate intake is greater in Asian countries and very few Asians eat a truly low carbohydrate diet.
  • High protein foods tend to be more expensive than high carbohydrate foods. Thus, very few people in developing countries can afford to follow a very low carbohydrate diet, and overall carbohydrate intake also tends to be higher in those countries.

Therefore, in Asian and developing countries the average carbohydrate intake is greater (~61%) than in the US and Europe (~50%), and the range of carbohydrate intake is from 45% to 80% of calories instead of 25% to 70%. With this range of intake, it is only possible to see the increase in mortality associated with very high carbohydrate intake.ARIC Study

In fact, when the authors of the current study overlaid the data from the PURE study with their ARIC data, there was an almost perfect fit. The only difference was that their ARIC data covered both low and high carbohydrate intake while the PURE study touted by low carb enthusiasts only covered moderate to high carbohydrate intake.

[I have given you my rendition of the graph on the right. If you would like to see the data yourself, look at the paper.]

Basically, low carb advocates are telling you that diets with carbohydrate intakes of 26% or less are healthy based on studies that did not include carbohydrate intakes below 40%. That is misleading. The studies they quote are incapable of detecting the risks of low carbohydrate diets.

In short, the ARIC study finally answered the question, “How much carbohydrate should we be eating if we desire a long and healthy life?” The answer is “Enough”.

I call this “The Goldilocks Effect”. You may remember “Goldilocks And The Three Bears”. One bed was too hard. One bed was too soft. But one bed was “just right”. One bowl of porridge was too hot. One was two cold. But one was “just right”.

According to this study, the same is true for carbohydrate intake. High carbohydrate intake is unhealthy. Low carbohydrate intake is unhealthy. But moderate carbohydrate intake is “just right”.

What Does This Study Mean For You?

QuestionsThere are several important take-home lessons from this study:

1) All major studies agree that very high carbohydrate intake is unhealthy. In part, that reflects the fact that diets with high carbohydrate intake are likely to be high in sodas and sugary junk foods. It may also reflect the fact that diets which are high in carbohydrates are often low in plant protein or healthy fats or both.

2) All studies that cover the full range of carbohydrate intake agree that low and very low carbohydrate diets are also unhealthy. They shorten the life expectancy of a 50-year-old by about 4 years.

3) The studies quoted by low carb enthusiasts to support their claim that low-carb and very low carb diets are healthy don’t include carbohydrate intakes below 40%. That means their claims are misleading. The studies they quote are incapable of detecting the risks of low carbohydrate diets. Their claims are a myth.

4) Not all high carb diets are created equally. As I noted above, the Mediterranean and DASH diets are just as high in carbohydrates as the typical American diet, but their carbohydrates come from whole fruits and vegetables, whole grains, beans, nuts, and seeds. And multiple studies show that both diets are much healthier than the typical American diet.

5) Not all low carb diets are created equally. Meat-based low-carb diets decrease life expectancy compared to the typical American diets while plant-based low carb diets increase life expectancy.

6) The health risks of meat-based low-carb diets may be due to the saturated fat content or the heavy reliance on red meat. However, the risks are just as likely to be due to the foods these diets leave out – typically fruits, whole grains, legumes, and some vegetables.

7) Proponents of low-carb diets assume that you can make up for the missing nutrients by just taking multivitamins. However, each food group also provides a unique combination of phytonutrients and fibers. The fibers, in turn, influence your microbiome. Simply put, whenever you leave out whole food groups, you put your health at risk.

The Bottom Line

The low-carb wars are raging. Several studies have reported that low carb diets increase risk of mortality (shorten lifespan). However, a study published a few years ago came to the opposite conclusion. That study had low carb enthusiasts doing a victory lap and claiming it is time to rewrite nutritional guidelines to favor low-carb diets.

However, a study published a year later resolves the conflicting data and finally answers the question: “How much carbohydrate should we be eating if we desire a long and healthy life?” The answer is “Enough”.

I call this “The Goldilocks Effect”. According to this study, high carbohydrate intake is unhealthy. Low carbohydrate intake is unhealthy. But moderate carbohydrate intake is “just right”.

Specifically, this study reported:

  • Moderate carbohydrate intake (50-55%) is healthiest. This is the carbohydrate intake found in healthy diets like the Mediterranean and DASH diets, and is the intake recommended by current nutritional guidelines.
  • All major studies agree that very high carbohydrate intake (60-70%) is unhealthy. It shortens the life expectancy of a 50-year-old by about a year.
  • All studies that cover the full range of carbohydrate intake agree that low carbohydrate intake (<26%) is also unhealthy. It shortens the life expectancy of a 50-year-old by about 4 years.
  • The studies quoted by low carb enthusiasts to support their claim that low-carb diets are healthy don’t include carbohydrate intakes below 40%. That means their claims are misleading. The studies they quote are incapable of detecting the risks of low carbohydrate diets.
  • Meat-based low-carb diets decrease life expectancy while plant-based low carb diets increase life expectancy. This is consistent with the results of previous studies.

The authors concluded: “Our findings suggest a negative long-term association between life-expectancy and both low carbohydrate and high carbohydrate diets…These data also provide further evidence that animal-based low carbohydrate diets should be discouraged.”

Simply put, the latest study means that the supposed benefits of low carb diets are a myth.

For more details, read the article above.

These statements have not been evaluated by the Food and Drug Administration. This information is not intended to diagnose, treat, cure or prevent any disease.

___________________________________________________________________________

My posts and “Health Tips From the Professor” articles carefully avoid claims about any brand of supplement or manufacturer of supplements. However, I am often asked by representatives of supplement companies if they can share them with their customers.

My answer is, “Yes, as long as you share only the article without any additions or alterations. In particular, you should avoid adding any mention of your company or your company’s products. If you were to do that, you could be making what the FTC and FDA consider a “misleading health claim” that could result in legal action against you and the company you represent.

For more detail about FTC regulations for health claims, see this link.

https://www.ftc.gov/business-guidance/resources/health-products-compliance-guidance

 ______________________________________________________________________

About The Author 

Dr. Chaney has a BS in Chemistry from Duke University and a PhD in Biochemistry from UCLA. He is Professor Emeritus from the University of North Carolina where he taught biochemistry and nutrition to medical and dental students for 40 years.  Dr. Chaney won numerous teaching awards at UNC, including the Academy of Educators “Excellence in Teaching Lifetime Achievement Award”. Dr Chaney also ran an active cancer research program at UNC and published over 100 scientific articles and reviews in peer-reviewed scientific journals. In addition, he authored two chapters on nutrition in one of the leading biochemistry textbooks for medical students.

Since retiring from the University of North Carolina, he has been writing a weekly health blog called “Health Tips From the Professor”. He has also written two best-selling books, “Slaying the Food Myths” and “Slaying the Supplement Myths”. And most recently he has created an online lifestyle change course, “Create Your Personal Health Zone”. For more information visit https://chaneyhealth.com.

For the past 53 years Dr. Chaney and his wife Suzanne have been helping people improve their health holistically through a combination of good diet, exercise, weight control and appropriate supplementation.

The Alcohol Myth

How Were We Led Astray?

Author: Dr. Stephen Chaney 

You have probably heard that moderate alcohol consumption is healthier than complete abstinence from alcohol. It is certainly a popular viewpoint.

It is also a scientific paradigm. By that I mean:

  • It is supported by multiple clinical studies.
  • Elaborate metabolic explanations have been proposed to support this paradigm.
  • It is the official position of most medical societies, scientific organizations, and health information sites on the web.
  • It is the recommendation of most health professionals.
  • It has been repeated so often from so many trusted sources that everyone assumes it must be true.

But is it a myth? You may have been surprised when you saw recent headlines saying, “Having an alcoholic drink or two per day is not healthier than abstaining.”

Today I will review the study (J Zhao et al, JAMA Network Open, 6(3): e236185, 2023) behind the headlines and tell you what it means for you.

But first, I want to explain to you how the scientific method works. That’s because this study is a perfect example of the scientific method in action.

How Were We Led Astray?

I have described the scientific method in detail in my books “Slaying The Food Myths” and “Slaying The Supplement Myths”, which you will find here.

Today, I will just give you a brief synopsis of the scientific method.

1) Most scientific studies are designed to disprove existing scientific paradigms. This is such a study.

  • In the scientific world, there is no glory in being the 10th person to prove that a scientific paradigm is correct. The glory comes from being the first person to disprove a scientific paradigm and create a new paradigm in the process.
  • This constant testing of existing paradigms is one of the most important strengths of the scientific method.

2) There is no perfect study. Every study has its flaws.

  • “Confounding variables” are flaws that can be the Achilles Heel of any association study.

Now let me explain the significance of these statements in the context of the current study:

  • All the studies supporting the current paradigm were association studies. Association studies measure the association between a selected variable and an outcome. For these studies, the selected variable was alcohol consumption, and the outcome was increased mortality.
    • Association studies try to statistically correct for other variables known to affect the outcome. For example, diseases like heart disease, diabetes, and cancer increase the risk of premature death. These are known variables that would be corrected for in any well-designed study of alcohol consumption and mortality.
    • “Confounding variables” are unknown variables that also affect the outcome of the study. But since they are unknown, they are not corrected for.

Let me give you a simplistic example of a confounding variable. Let’s say you were doing a study of dietary habits, and you found an association between ice cream consumption and mortality. You might conclude that ice cream consumption is bad for you. It increases your risk of dying.

But then you might remember that ice cream consumption increases during the summer. And then you might reason that people swim more during the summer, and there is a correlation between swimming and drowning deaths.

Swimming could be a confounding variable. To make sure that your initial conclusion that ice cream increases the risk of dying was correct, you would need to correct your data for swimming deaths during the summer and see if you still found a correlation between ice cream consumption and mortality.

Could The Current Paradigm Be Incorrect?

SkepticYou might be thinking, “What does this have to do with studies on the correlation between alcohol consumption and increased mortality?” Let me explain.

The baseline group for these comparisons was the abstainers – the group consuming no alcohol. Previous studies have compared the mortality risk associated with various amounts of alcohol consumption with the mortality risk of the abstainer group. This sounds like a reasonable approach.

But the investigators challenging the current paradigm noted that the “abstainer group” in previous studies included both lifetime abstainers and former drinkers who had become abstainers. They hypothesized that the “former drinkers” group may have become abstainers because of health issues related to excess alcohol consumption.

In short, they hypothesized that the “former drinkers” group was a confounding variable that biased the results of the previous studies. They hypothesized that the “lifetime abstainers” group was a more appropriate baseline group for this kind of study. They then set out to prove their hypothesis.

How Was This Study Done?

clinical studyThe investigators searched the literature and found 107 studies with 4.8 million participants published between 1980 and July 21, 2021, that:

  • Assessed the correlation between alcohol consumption and mortality.
  • Had data that allowed the investigators to separate lifetime abstainers from former drinkers who had become abstainers.

The investigators divided alcohol consumption into low, moderate, high, and very high categories based on the ounces of alcohol consumed per day. Since ounces of alcohol is not an easy measure for most of us, I have converted ounces/day to drinks/day based on the CDC definition of a drink (a 12-ounce beer, 5-ounce glass of wine, or 1.5 ounces of a distilled spirit like gin or vodka). And to make it even simpler, I have rounded to the nearest whole number. With that said, here are the classifications.

  • Low alcohol intake = 1-2 drinks/day.
  • Moderate alcohol intake = 2-3 drinks/day.
  • High alcohol intake = 3-4 drinks/day.
  • Very high alcohol intake = >4 drinks/day.

The risk of death associated with each of these intake levels was compared the risk of death of their preferred baseline group, the “lifetime abstainers”.

Finally, the data were corrected for other variables known to influence the correlation between alcohol consumption and mortality, namely age, sex, heart health, social status, race, diet, exercise, BMI, and smoking status. [These are known confounding variables and had been adjusted for in most previous studies.]

The Alcohol Myth

Red WineWhen the investigators compared the mortality risk of former drinkers who had become abstainers with lifetime abstainers:

  • The former drinkers were 31% more likely to die, and this difference was highly significant.
  • This is consistent with their hypothesis that the “former drinkers” group was a confounding variable that may have biased the conclusions of previous studies.

When they compared the mortality risk of various levels of alcohol consumption with lifetime abstainers instead of all abstainers, they found:

  • The risk of mortality associated with low (1-2 drinks/day) and moderate (2-3 drinks/day) alcohol intake was statistically identical to the risk of mortality for lifetime abstainers.
  • The high alcohol intake group (3-4 drinks/day) was 24% more likely to die than the lifetime abstainers.
  • The very high alcohol intake group (>4 drinks/day) was 39% more likely to die than the lifetime abstainers.

In short, when lifetime abstainers were used as the baseline group, low to moderate alcohol intake did not reduce the risk of dying, as previous studies had suggested. This study suggests the idea that low to moderate alcohol consumption is good for us may not be accurate. It may be a myth.

Finally, there was a significant gender difference in the effect of alcohol consumption on mortality.

For women:

  • Even moderate alcohol consumption was associated with an increased risk of mortality. Only low alcohol consumption posed no increase in mortality.
  • The increased risk of mortality for women was significantly higher than for men with every level of alcohol consumption.

The authors concluded, “In this…meta-analysis, daily low or moderate alcohol intake was not significantly associated with all-cause mortality risk, while increased risk was evident at higher consumption levels, starting at lower levels for women than for men.”

Of course, this isn’t the end of the story. The scientific method will continue. Old paradigms don’t die easily. Other investigators will challenge the conclusions of this study. Stay tuned. I will give you updates as future studies are published.

What Does This Study Mean For You?

QuestionsIf you like to imbibe, there are two important takeaways from this study.

The bad news is that you can no longer claim that a drink or two a day is healthier than total abstinence from alcohol.

The good news is that this and every study preceding it have found that a drink or two a day is no less healthy than total abstinence. The studies found no increase in mortality associated with low to moderate alcohol intake.

[However, low to moderate alcohol intake may increase your risk of specific diseases. For example, many studies suggest that even low alcohol intake is associated with an increased risk of breast cancer.]

This study also agrees with previous studies that high alcohol intake increases your risk of death, and women are more susceptible to adverse effects of alcohol intake than men.

So, while this study challenges the existing paradigm that low to moderate alcohol intake is beneficial, it does not change the current recommendations on alcohol intake by most health organizations.

For example, the current CDC guidelines are:

  • Adults of legal drinking age should limit alcohol intake to 2 drinks or less per day for men and one drink or less per day for women.
  • Adults who do not drink alcohol should not start. [The current study strengthens this recommendation because it takes away the excuse that low to moderate alcohol consumption is healthier than abstinence.]
  • Drinking less is better than drinking more.

The CDC guidelines also note that the risk of some cancers increases even at very low levels of alcohol consumption.

Finally, the CDC recommends that some people never consume alcohol, including:

  • Women who are pregnant or might become pregnant.
  • Anyone younger than 21.
  • Anyone with medical conditions or medications that interact with alcohol.
  • Anyone recovering from an alcohol use disorder or who has trouble controlling the amount they drink.

The Bottom Line 

A recent study is a perfect example of the scientific method in action. Scientists are constantly challenging the existing scientific paradigms, and this is an important strength of the scientific method.

A group of scientists recently published a study challenging the paradigm that low to moderate alcohol intake is healthier than total abstinence from alcohol.

They hypothesized that previous studies supporting this paradigm had a common methodological flaw, corrected for the flaw, and reanalyzed the data from 104 studies with a total of 4.8 million participants.

The revised data showed no health benefit of low to moderate alcohol consumption compared to total abstinence. When you look at the data more closely, the current paradigm may be a myth.

  • This is a major change to the existing paradigm because it removes the justification for low to moderate alcohol consumption.

However, the revised data did not differ from previous studies in the following ways:

  • There is no health risk associated with low to moderate alcohol intake compared to total abstinence.
  • High alcohol intake (>3 drinks/day) is associated with increased mortality.
  • Women are more sensitive to the adverse effects of alcohol than men.

So, this study does not change current guidelines for alcohol consumption.

For more information on this study, what it means for you, and the CDC guidelines on alcohol consumption read the article above.

These statements have not been evaluated by the Food and Drug Administration. This information is not intended to diagnose, treat, cure, or prevent any disease.

______________________________________________________________________________

My posts and “Health Tips From the Professor” articles carefully avoid claims about any brand of supplement or manufacturer of supplements. However, I am often asked by representatives of supplement companies if they can share them with their customers.

My answer is, “Yes, as long as you share only the article without any additions or alterations. In particular, you should avoid adding any mention of your company or your company’s products. If you were to do that, you could be making what the FTC and FDA consider a “misleading health claim” that could result in legal action against you and the company you represent.

For more detail about FTC regulations for health claims, see this link.

https://www.ftc.gov/business-guidance/resources/health-products-compliance-guidance

______________________________________________________________________

About The Author 

Dr. Chaney has a BS in Chemistry from Duke University and a PhD in Biochemistry from UCLA. He is Professor Emeritus from the University of North Carolina where he taught biochemistry and nutrition to medical and dental students for 40 years.  Dr. Chaney won numerous teaching awards at UNC, including the Academy of Educators “Excellence in Teaching Lifetime Achievement Award”. Dr Chaney also ran an active cancer research program at UNC and published over 100 scientific articles and reviews in peer-reviewed scientific journals. In addition, he authored two chapters on nutrition in one of the leading Biochemistry textbooks for medical students.

Since retiring from the University of North Carolina, he has been writing a weekly health blog called “Health Tips From the Professor”. He has also written two best-selling books, “Slaying the Food Myths” and “Slaying the Supplement Myths”. And most recently he has created an online lifestyle change course, “Create Your Personal Health Zone”. For more information visit https://chaneyhealth.com.

For the past 53 years Dr. Chaney and his wife Suzanne have been helping people improve their health holistically through a combination of good diet, exercise, weight control and appropriate supplementation.

Do Optimists Live Longer?

What Does This Study Mean For You? 

Author: Dr. Stephen Chaney 

You have probably heard the statement that optimists live longer before. In fact, you have probably heard so many times you assume it must be true. But is it a myth or is it the truth?

This question is important because it can affect how people feel about themselves. If you are a natural optimist, statements like this support your feeling of self-worth. But if you are naturally pessimistic, statements like this provide one more reason to feel bad about yourself.

For example, a recent article on the topic in WebMD starts with the statement, “Want to live longer? You might want to try improving your outlook on life.” I am mostly optimistic, so I find this statement to be positive and encouraging.

But I am not sure I would feel about this statement if I were pessimistic or depressed and had tried for years to be more optimistic.

Because of this it is important to ask, “How good is the evidence supporting this claim?”

There are several published studies supporting this claim (For example). However,

  • Most of these studies have been performed with white, high-income participants. It is not clear whether these same results would apply to other racial and ethnic groups.
  • There is also the “chicken versus egg” conundrum. The studies claiming that optimists live longer are all association studies. Simply put, that means optimism is associated with longevity, but does not prove cause and effect. That is important because:
    • Some studies show that both a healthy diet and exercise improve mood.
    • Other studies show that optimists tend to take better care of themselves, and that includes both diet and exercise.
    • So, it’s hard to know which comes first – a healthy lifestyle, which creates optimism, or optimism, which creates a healthy lifestyle.
  • Because of this “chicken versus egg” conundrum, it is not clear whether it is a healthy lifestyle or optimism that is the primary cause of greater longevity.

The study (HK Koga et al, Journal of the American Geriatrics Society, 70: 2793-2804, 2022)) I will review today was designed to answer both questions. Specifically, this study was designed to ask:

  • Is higher optimism associated with a longer lifespan and exceptional longevity across diverse racial and ethnic groups?
  • To what extent do lifestyle factors influence this association?

How Was The Study Done?

clinical studyThe data for this study was obtained from the Women’s Health Initiative which enrolled 161,808 postmenopausal women of diverse racial and ethnic groups from 40 medical centers within the United States between 1993 and 1998. The women were aged 50-79 (average = 63.5) at enrollment and were followed for an average of 26 years.

Optimism was assessed at enrollment into the program using the 6-item Life Orientation Test Revised. For each item on the questionnaire, participants were asked to report the degree they agreed with each statement on a scale of 1 = “strongly agree” to 5 = “strongly disagree”. Their responses were summed to create scores ranging from 6 to 30, with 30 being the highest optimism rating.

Lifestyle was assessed on a questionnaire measuring diet quality, physical activity, BMI (a measure of obesity), smoking status, and alcohol consumption. If participants met predefined “healthy standards in each of these categories, they were given a score of 1. Otherwise, their score was 0. Scores from each category were summed to create a composite lifestyle score ranging from 0 (least healthy) to 5 (most healthy).

Longevity was based on survival compared to national averages using the National Death Index (Yes, “Big Brother” is watching you even when you die) to identify and confirm deaths. Deaths of participants were monitored through March 1, 2019. Exceptional longevity was defined as survival to age 90 or older. Overall, 64,301 women (40.3%) died over the 26 years of follow-up.

Finally, women who died within the first 2 years of follow-up were excluded from the data analysis “to mitigate concerns that health status might affect the reporting or experience of optimism levels.” In plain English, people who are within 2 years of dying are often very sick and feel lousy. Even the most optimistic individuals find it hard to maintain an optimistic outlook in those circumstances. This left 159,255 women in the database.

Do Optimists Live Longer?

When comparing women in the highest to women in the lowest quartile of optimism:

  • Longevity was increased by 5.4%, which corresponds to an additional 4.4 years. When this was broken down by race and ethnicity, longevity was increased by:
    • 1% for Non-Hispanic White women.
    • 6% for Black women.
    • 4% for Hispanic women.
    • 5% for Asian women. However, this may have been an underestimate because of the small sample size of this population in the Women’s Health Initiative database.
  • Exceptional longevity (survival ≥ 90 years) was increased 10%.

When the authors used a complex statistical method to assess the contribution of lifestyle to the increase in longevity, they found:

  • Lifestyle contributed to 24% of the increased longevity. When this was broken down by race and ethnicity, lifestyle contributed:
    • 25% for Non-Hispanic White women.
    • 10% for Black women.
    • 24% for Hispanic women.
    • 43% for Asian women.

The authors concluded, “We found that higher levels of optimism were associated with longer lifespan and greater likelihood of achieving exceptional longevity across racial and ethnic groups, suggesting the health benefits of optimism may hold across these groups.”

“The contribution of lifestyle to these associations was evident but modest.”

“As prior work has demonstrated that optimism is modifiable, it may be a novel target for interventions that aim to extend lifespan across diverse racial and ethnic groups.”

What Are The Strengths And Weaknesses Of This Study?

strengths and weaknessesThis is not the first study to suggest that optimists live longer. But it is the best study to date because:

  • It was larger (159,255 participants) than most previous studies.
  • It followed the participants far longer (26 years) than previous studies.
  • It included a more racially and ethnically diverse group of participants than previous studies.
  • It addressed the “elephant in the room” for studies of this type, namely that optimists tend to actively seek a healthier lifestyle, so the “benefits” of optimism could be due to a healthy lifestyle rather than a state of mind. The study employed statistics to estimate that a healthy lifestyle contributed around 25% to the longevity experienced by optimists.

However, the study did have some weaknesses. In my opinion, the most important weaknesses were:

  • Optimism and lifestyle were only assessed at the beginning of the study. No effort was made to determine whether either of these important variables changed during the 26-year study.
  • The relative influence of lifestyle and optimism on longevity was based on a complex statistical analysis. As Mark Twain said, “There are lies, damn lies, and statistics.” Simply put, statistics can sometimes give misleading answers. I would like to see this very important part of the study confirmed using a different method of analysis.

What Does This Study Mean For You?

Questioning WomanAs I shared above, I have some misgivings about this and other studies claiming that optimists live longer. But let’s assume this claim is true. What does that mean for you?

A 5.4% increase in lifespan might not sound like much, but it added 4.4 years to the lives of the women in the study. What would you do with an extra 4.4 years?

And, as the authors of the study pointed out, that’s equivalent to the gain in lifespan for adults engaged in a regular exercise program. Are those benefits addible? We don’t know, but it is possible that an optimist who exercised regularly and had a healthy diet might experience more than a 4-year gain in lifespan.

The authors said, “Although optimism is partly heritable (23-32%), experimental research has demonstrated that optimism is modifiable…”

Let me share a few things that have helped me maintain a more optimistic outlook:

  • Affirmations and visualizations of a positive future.
  • I start my daily prayers by listing the things I am grateful for. For others, a gratitude journal works equally well.
  • Accept positive input. You can accept compliments with humility by simply thanking the person for the compliment. But in your mind, use the compliment to overcome your inner doubts of self-worth.
  • Question negative input. Ask if each critic is the kind of person you want to become. If so, ask if what they said is really true.
  • Create a support network. These are family and friends who will support you when you need it and will give you a gentle kick in the …. when you need that.
  • Trust in a higher power. I know from experience that it is only God who can give me the “peace that passes all understanding” in my most difficult circumstances. And while I am Christian, I think this is a cornerstone of most religions.

Finally, I know that many people are predisposed to depression and pessimism, so I don’t want to be like the author of the WebMD article and tell you, “Want to live longer? You might want to try improving your outlook on life.”

We know that a healthy lifestyle is associated with longevity. And you don’t have to be an optimist to choose a healthy diet, exercise regularly, avoid smoking and excess alcohol intake, and get regular health check-ups.

We also know these things are associated with a longer healthspan which, simply put, is the number of years you live in good health.

So, whether you are a pessimist or an optimist you can live healthier longer.

The Bottom Line

You have probably heard that optimists live longer, but is it true? In the article above I describe the latest study on this topic. It is better than most previous studies on this topic because:

  • It was larger (159,255 participants) than most previous studies.
  • It followed the participants far longer (26 years) than previous studies.
  • It included a more racially and ethnically diverse group of participants than previous studies.
  • It addressed the “elephant in the room” for studies of this type, namely that optimists tend to actively seek a healthier lifestyle, so the “benefits” of optimism could be due to a healthy lifestyle rather than a state of mind. The study employed statistics to estimate that a healthy lifestyle contributed around 25% to the longevity experienced by optimists.

When the study compared women in the highest to women in the lowest quartile of optimism:

  • Longevity was increased by 5.4%, which corresponds to an additional 4.4 years.
  • Exceptional longevity (survival ≥ 90 years) was increased by 10%.
  • Lifestyle contributed to 24% of the increased longevity.

The authors concluded, “We found that higher levels of optimism were associated with longer lifespan and greater likelihood of achieving exceptional longevity across racial and ethnic groups, suggesting the health benefits of optimism may hold across these groups.”

“As prior work has demonstrated that optimism is modifiable, it may be a novel target for interventions that aim to extend lifespan across diverse racial and ethnic groups.”

For more details on this study and what it means for you, read the article above.

These statements have not been evaluated by the Food and Drug Administration. This information is not intended to diagnose, treat, cure or prevent any disease.

______________________________________________________________________________

My posts and “Health Tips From the Professor” articles carefully avoid claims about any brand of supplement or manufacturer of supplements. However, I am often asked by representatives of supplement companies if they can share them with their customers.

My answer is, “Yes, as long as you share only the article without any additions or alterations. In particular, you should avoid adding any mention of your company or your company’s products. If you were to do that, you could be making what the FTC and FDA consider a “misleading health claim” that could result in legal action against you and the company you represent.

For more detail about FTC regulations for health claims, see this link.

https://www.ftc.gov/business-guidance/resources/health-products-compliance-guidance

______________________________________________________________________

About The Author 

Dr. Chaney has a BS in Chemistry from Duke University and a PhD in Biochemistry from UCLA. He is Professor Emeritus from the University of North Carolina where he taught biochemistry and nutrition to medical and dental students for 40 years.

Dr. Chaney won numerous teaching awards at UNC, including the Academy of Educators “Excellence in Teaching Lifetime Achievement Award”.

Dr Chaney also ran an active cancer research program at UNC and published over 100 scientific articles and reviews in peer-reviewed scientific journals. In addition, he authored two chapters on nutrition in one of the leading biochemistry text books for medical students.

Since retiring from the University of North Carolina, he has been writing a weekly health blog called “Health Tips From the Professor”. He has also written two best-selling books, “Slaying the Food Myths” and “Slaying the Supplement Myths”. And most recently he has created an online lifestyle change course, “Create Your Personal Health Zone”. For more information visit https://chaneyhealth.com.

For the past 45 years Dr. Chaney and his wife Suzanne have been helping people improve their health holistically through a combination of good diet, exercise, weight control and appropriate supplementation.
Can You Create Your Personal Fountain Of Youth?

Can A Healthy Lifestyle Improve Your Healthspan?

Author: Dr. Stephen Chaney

Fountain Of YouthEver since Ponce de Leon led an expedition to the Florida coast in 1513, we have been searching for the mythical “Fountain Of Youth”. What does that myth mean?

Supposedly, just by immersing yourself in that fountain you would be made younger. You would experience all the exuberance and health you enjoyed when you were young. There have been many snake oil remedies over the years that have promised that. They were all frauds.

But what if you had it in your power to live longer and to retain your youthful health for most of those extra years. The ability to live healthier longer is something that scientists call “healthspan”. But you can think of it as your personal “Fountain Of Youth”.

Now comes the important question, “Can a healthy lifestyle improve your healthspan?” We know a healthy lifestyle is good for us. Most of us know what a healthy lifestyle is. But it’s so hard. Is it worth it? Will it actually increase our lifespan? Will it increase our healthspan?

Today I am sharing two studies from the prestigious Harvard T.H. Chan School of Public Health that answer those questions.

How Were The Studies Done?

clinical studyThese studies started by combining the data from two major clinical trials:

  • The Nurse’s Health Study, which ran from 1980 to 2014.
  • The Health Professional’s Follow-Up Study, which ran from 1986-2014.

These two clinical trials enrolled 78,865 women and 42,354 men and followed them for an average of 34 years. During this time there were 42,167 deaths. All the participants were free of heart disease, type 2 diabetes, and cancer at the time they were enrolled. Furthermore, the design of these clinical trials was extraordinary.

  • A detailed food frequency questionnaire was administered every 2-4 years. This allowed the investigators to calculate cumulative averages of all dietary variables.
  • Participants also filled out questionnaires that captured information on disease diagnosis every 2 years with follow-up rates >90%. This allowed the investigators to measure the onset of disease for each participant during the study. More importantly, 34 years is long enough to measure the onset of diseases like heart disease, diabetes, and cancer – diseases that require decades to develop.
    • The questionnaires also captured information on medicines taken and lifestyle characteristics such as body weight, exercise, smoking and alcohol use.
  • For analysis of diet quality, the investigators use something called the “Alternative Healthy Eating Index”. [The original Healthy Eating Index was developed about 10 years ago based on the 2010 “Dietary Guidelines for Americans”. Those guidelines have since been updated, and the “Alternative Healthy Eating Index” is based on the updated guidelines.] You can calculate your own Alternative Healthy Eating Index below, so you can see what is involved.
  • Finally, the investigators included five lifestyle-related factors – diet, smoking, physical activity, alcohol consumption, and BMI (a measure of obesity) – in their estimation of a healthy lifestyle. Based on the best available evidence, they defined “low-risk” in each of these categories. Study participants were assigned 1 point for each low-risk category they achieved. Simply put, if they were low risk in all 5 categories, they received a score of 5. If they were low risk in none of the categories, they received a score of 0.
  • Low risk for each of these categories was defined as follows:
    • Low risk for a healthy diet was defined as those who scored in the top 40% in the Alternative Healthy Eating Index.
    • Low risk for smoking was defined as never smoking.
    • Low risk for physical activity was defined as 30 minutes/day of moderate or vigorous activities.
    • Low risk for alcohol was defined as 0.5-1 drinks/day for women and 0.5-2 drinks/day for men.
    • Low risk for weight was defined as a BMI in the healthy range (18.5-24.9 kg/m2).

Can A Healthy Lifestyle Improve Your Healthspan?

Older Couple Running Along BeachThe investigators compared participants who scored as low risk in all 5 categories with participants who scored as low risk in 0 categories (which would be typical for many Americans). For simplicity, I will refer to people who scored as low risk in 5 categories as having a “healthy lifestyle” and those who scored as low risk in 0 categories as having an “unhealthy lifestyle”.

The results of the first study were:

  • Women who had had a healthy lifestyle lived 14 years longer than women with an unhealthy lifestyle (estimated life expectancy of 93 versus 79).
  • Men who had a healthy lifestyle lived 12 years longer than men with an unhealthy lifestyle (estimated life expectancy was 87 versus 75).
  • It was not necessary to achieve a perfect lifestyle. Life expectancy increased in a linear fashion for each low-risk lifestyle behavior achieved.

The authors of the study concluded: “Adopting a healthy lifestyle could substantially reduce premature mortality and prolong life expectancy in US adults. Our findings suggest that the gap in life expectancy between the US and other developed countries could be narrowed by improving lifestyle factors.”

The results of the second study were:

  • Women who had a healthy lifestyle lived 11 years longer free of diabetes, heart disease, and cancer than women who had an unhealthy lifestyle (estimated disease-free life expectancy of 85 years versus 74 years).
  • Men who had a healthy lifestyle lived 8 years longer free of diabetes, heart disease, and cancer than men who had an unhealthy lifestyle (estimated disease-free life expectancy of 81 years versus 73 years).
  • Again, disease-free life expectancy increased in a linear fashion for each low-risk lifestyle behavior achieved.

The authors concluded: “Adherence to a healthy lifestyle at mid-life [They started their analysis at age 50] is associated with a longer life expectancy free of major chronic diseases. Our findings suggest that promotion of a healthy lifestyle would help reduce healthcare burdens through lowering the risk of developing multiple chronic diseases, including cancer, cardiovascular disease, and diabetes, and extending disease-free life expectancy.”

Can You Create Your Personal Fountain Of Youth?

questionsI posed the question at the beginning of this article, “Can you create your personal Fountain Of Youth”?” These two studies showed that you can improve both your life expectancy and your disease-free life expectancy by simply changing your lifestyle. So, the answer to the original question appears to be, “Yes, you can improve your healthspan. You can create your personal “Fountain of Youth.”

However, as a nation we appear to be moving in the wrong direction. The percentage of US adults adhering to a healthy lifestyle has decreased from 15% in 1988-1992 to 8% in 2001-2006.

Finally, I know you have some questions, and I have answers.

Question: What about supplementation? Will it also improve my healthspan?

Answer: When the investigators analyzed the data, they found that those with the healthiest lifestyles were also more likely to be taking a multivitamin. So, they attempted to statistically eliminate any effect of supplement use on the outcomes. That means these studies cannot answer that question.

However, if you calculate your Alternate Healthy Eating Index below, you will see that most of us fall short of perfection. Supplementation can fill in the gaps.

Question: I cannot imagine myself reaching perfection in all 5 lifestyle categories? Should I even try to achieve low risk in one or two categories?

Answer: The good news is that there was a linear increase in both life expectancy and disease-free life expectancy as people went from low-risk in one category to low-risk in all 5 categories. I would encourage you to try and achieve low risk status in as many categories as possible, but very few of us, including me, achieve perfection in all 5 categories.

Question: I am past 50 already. Is it too late for me to improve my healthspan?

Answer: Diet and some of the other lifestyle behaviors were remarkably constant over 34 years in both the Nurse’s Health Study and the Health Professional’s Follow-Up Study. That means that the lifespan and healthspan benefits reported in these studies probably resulted from adhering to a healthy lifestyle for most of their adult years.

However, it is never too late to start improving your lifestyle. You may not achieve the full benefits described in these studies, but you still can add years and disease-free years to your life.

How To Calculate Your Alternative Healthy Eating Index 

You can calculate your own Alternative Healthy Eating Index score by simply adding up the points you score for each food category below.

Vegetables

Count 2 points for each serving you eat per day (up to 5 servings).

One serving = 1 cup green leafy vegetables or ½ cup for all other vegetables.

Do not count white potatoes or processed vegetables like French fries or kale chips.

Fruits

Count 2½ points for each serving you eat per day (up to 4 servings).

One serving = 1 piece of fruit or ½ cup of berries.

          (do not count fruit juice or fruit incorporated into desserts or pastries). 

Whole Grains

Count 2 points for each serving you eat per day (up to 5 servings).

One serving = ½ cup whole-grain rice, bulgur and other whole grains, cereal, and pasta or 1 slice of bread.

(For processed foods like pasta and bread, the label must say 100% whole grain).

Sugary Drinks and Fruit Juice

Count 10 points if you drink 0 servings per week.

Count 5 points for 3-4 servings per week (½ serving per day).

Count 0 points for 7 or more servings per week (≥1 serving per day).

One serving = 8 oz. fruit juice, sugary soda, sweetened tea, coffee drink, energy drink, or sports drink.

Nuts and Beans

Count 10 points if you eat 7 or more servings per week (≥1 serving per day).

Count 5 points for 3-4 servings per week (½ serving per day).

Count 0 points for 0 servings per week.

One serving = 1 oz. nuts or seeds, 1 Tbs. peanut butter, ½ cup beans, 3½ oz. tofu.

Red and Processed Meat

Count 10 points if you eat 0 servings per week.

Count 7 points for 3-4 servings per week (½ serving per day).

Count 3 points for 3 servings per week (1 serving per day).

Count 0 points for ≥1½ servings per day.

One serving = 1½ oz. processed meats (bacon, ham, sausage, hot dogs, deli meat)

          Or 4 oz. red meat (steak, hamburger, pork chops, lamb chops, etc.)

Seafood

Count 10 points if you eat 2 servings per week.

Count 5 points for 1 serving per week.

Count 0 points for 0 servings per week.

1 serving = 4 oz.

Now that you have your total, the scoring system is:

  • 41 or higher is excellent
  • 37-40 is good
  • 33-36 is average (remember that it is average to be sick in this country)
  • 28-32 is below average
  • Below 28 is poor

Finally, for the purposes of these two studies, a score of 37 or higher was considered low risk.

The Bottom Line 

Two recent studies have developed a healthy lifestyle score based on diet, exercise, body weight, smoking, and alcohol use. When they compared the effect of lifestyle on both lifespan (life expectancy) and healthspan (disease-free life expectancy), they reported:

  • Women who had had a healthy lifestyle lived 14 years longer than women with an unhealthy lifestyle.
  • Men who had a healthy lifestyle lived 12 years longer than men with an unhealthy lifestyle.
  • Women who had a healthy lifestyle lived 11 years longer free of diabetes, heart disease, and cancer than women had an unhealthy lifestyle.
  • Men who had a healthy lifestyle lived 8 years longer free of diabetes, heart disease, and cancer than men who had an unhealthy lifestyle.
  • It is not necessary to achieve a perfect lifestyle. Lifespan and healthspan increased in a linear fashion for each low-risk lifestyle behavior (diet, exercise, body weight, smoking, and alcohol use) achieved.
  • These studies did not evaluate whether supplement use also affects healthspan.
    • However, if you calculate your diet with the Alternate Healthy Eating Index they used (see above), you will see that most of us fall short of perfection. Supplementation can fill in the gaps.

The authors concluded: “Our findings suggest that promotion of a healthy lifestyle would help reduce healthcare burdens through lowering the risk of developing multiple chronic diseases, including cancer, cardiovascular disease, and diabetes, and extending disease-free life expectancy.”

For more details, including how to calculate your Alternative Healthy Eating Index, read the article above.

These statements have not been evaluated by the Food and Drug Administration. This information is not intended to diagnose, treat, cure, or prevent any disease.

Health Tips From The Professor